I used to work on a research project I wrote up as Record in Embedded Devices and Replay in Emulators. The project aims to collect selected events from a running embedded device (with Cortex-M as a test target). Those events are sent to a remote backend, which attempts to reconstruct the execution for later dynamic analysis. Here I want to focus on one part of that work: compile-time instrumentation. It made me think about how much freedom we gain when we can define the events an analysis receives.
What hardware trace already does
When I used Ozone with a J-Link EDU, the instruction trace available to me was limited to what remained in the target’s on-chip trace buffer. Ozone can also analyze streaming instruction trace from a J-Trace PRO when the target and trace connection support it, and it can use that trace to identify code hot spots. In my setup, I used SEGGER RTT over J-Link to report selected events while the firmware ran. The compiler inserted calls to my runtime at the points I wanted to observe, and the runtime sent messages over RTT. RTT works with J-Link on supported targets that allow background memory access; it needs neither an ETB nor dedicated trace pins. These event messages are different from a complete instruction trace.
My prototype used this path to observation. I flashed instrumented firmware to a NUCLEO-H753ZI board and viewed its RTT messages in Ozone’s Terminal through a J-Link EDU. The messages came from runtime calls inserted into the firmware; they were not a J-Trace hardware instruction stream. Those calls reported the order of selected events, not every instruction executed between them.
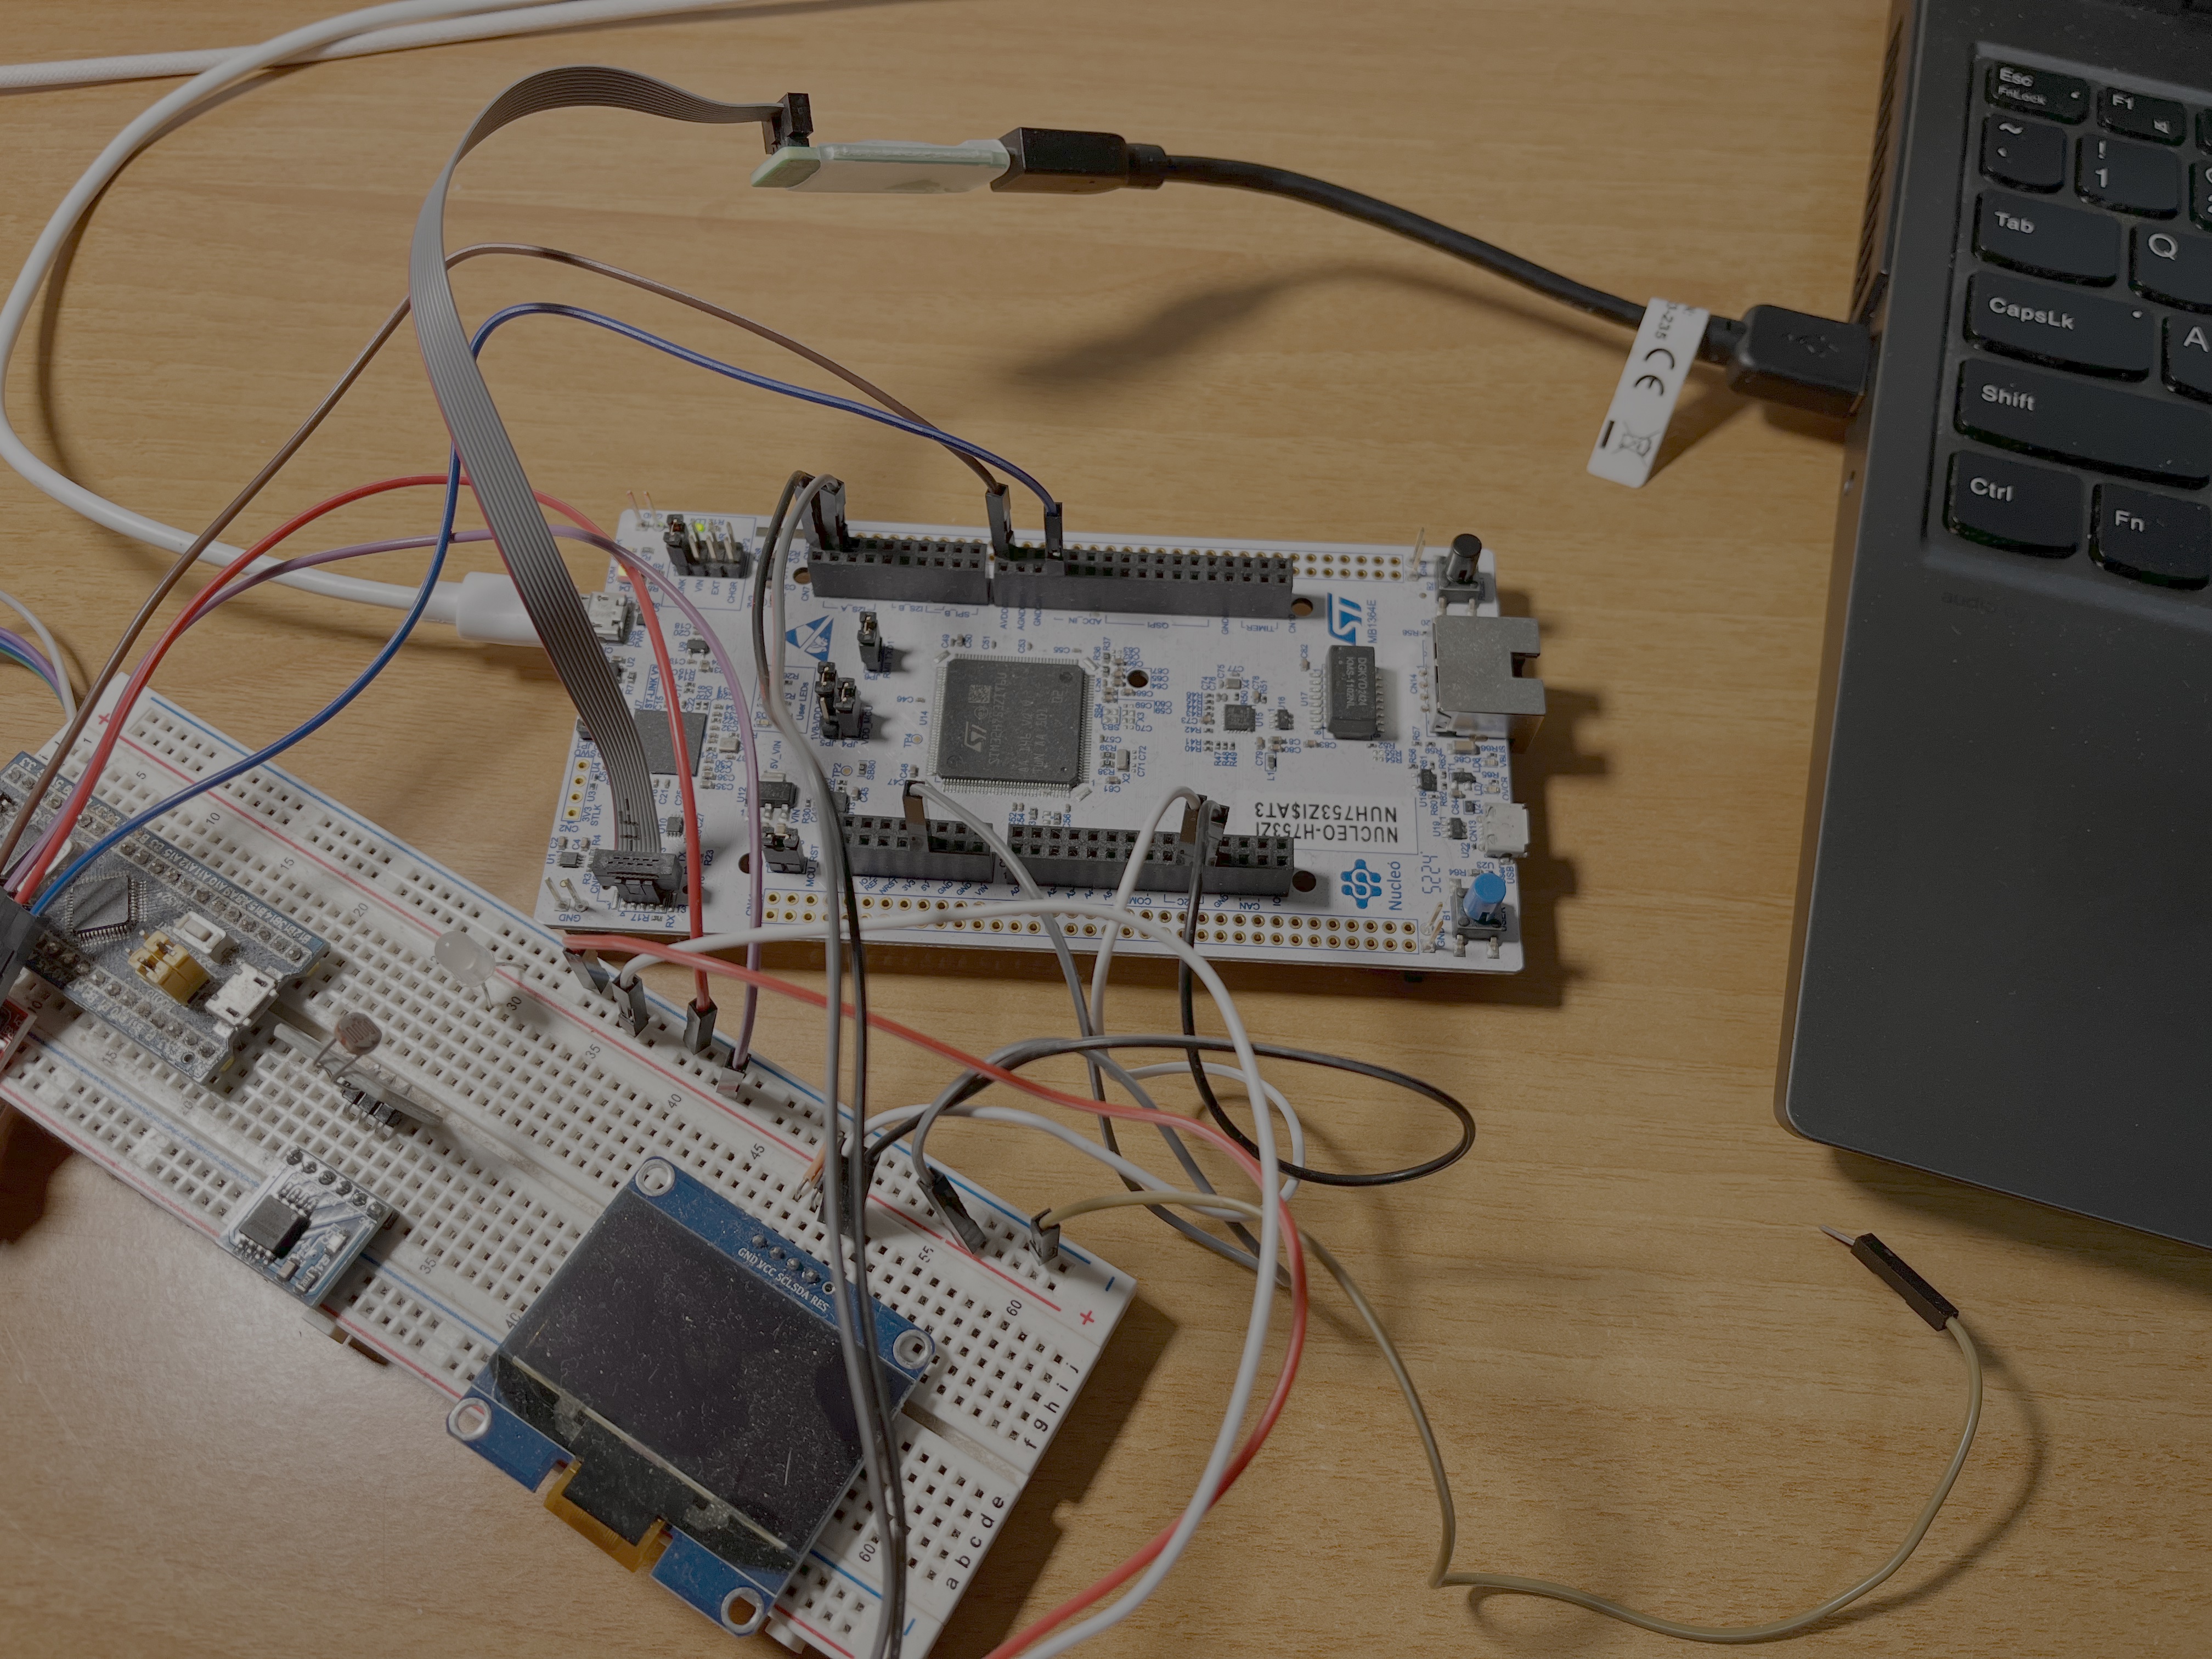
The development setup from the project report. RTT carried the prototype’s messages to the workstation; a production communication channel was still future work.
Placing probes at the events I cared about
The project aims to record nondeterministic control-flow events that could depend on external state: conditional branches, switch cases, indirect-call targets, and interrupt entry and return. LLVM IR passes inserted the branch, switch, and call hooks. ARM machine passes handle interrupt context and reserved r9 for a software instruction counter incremented before selected backward branches. The design used the counter and interrupted PC to locate interrupt occurrences relative to execution. That method requires complete coverage of repeated control-flow paths; calls and parts of the standard libraries remained uncovered in this prototype.
The following fragments present Ghidra decompilation of the firmware before and after instrumentation:
/* Before: an indirect call through a small function table. */
pcVar3 = local_1c[rand() % 4];
(*pcVar3)(500);

/* After: report the resolved target before making the same call. */
pcVar3 = local_1c[rand() % 4];
func_ptr = pcVar3;
RR_RUNTIME_IndirectCall(func_ptr);
(*pcVar3)(500);
That hook turns a machine-level jump into an explicit event: which function did this dispatch reach? The same principle appears at a branch and a switch case:
if (iVar1 != 0) {
    RR_RUNTIME_CondBranch_1();
    Error_Handler();
}
RR_RUNTIME_CondBranch_0();

switch (clock_source) {
case 1:
    RR_RUNTIME_Switch(2);
    /* The original case body follows. */
    break;
/* Other cases have their own event IDs. */
}
The branch fragment follows the decompiler’s control flow; the switch fragment simplifies its condition and body for readability. Notice that RR_RUNTIME_Switch(2) is an event ID for case 1, not the case value itself. A consumer of these events needs the mapping between emitted IDs and program locations.
Interrupts make probe placement more delicate. In the decompiled SysTick_Handler, the inserted code uses the exception return value in LR to choose the main or process stack, then marks both entry and return:
uint32_t saved_sp = (in_lr & 4)
    ? getProcessStackPointer()
    : getMainStackPointer();
RR_RUNTIME_ISR(saved_sp);
HAL_IncTick();
RR_RUNTIME_Ret();
The machine pass matters here because it can access architectural registers needed to interpret the exception context. That is a concrete example of instrumentation’s flexibility: I could choose a lower-level observation point for interrupts while keeping the branch, switch, and call hooks at LLVM IR level.
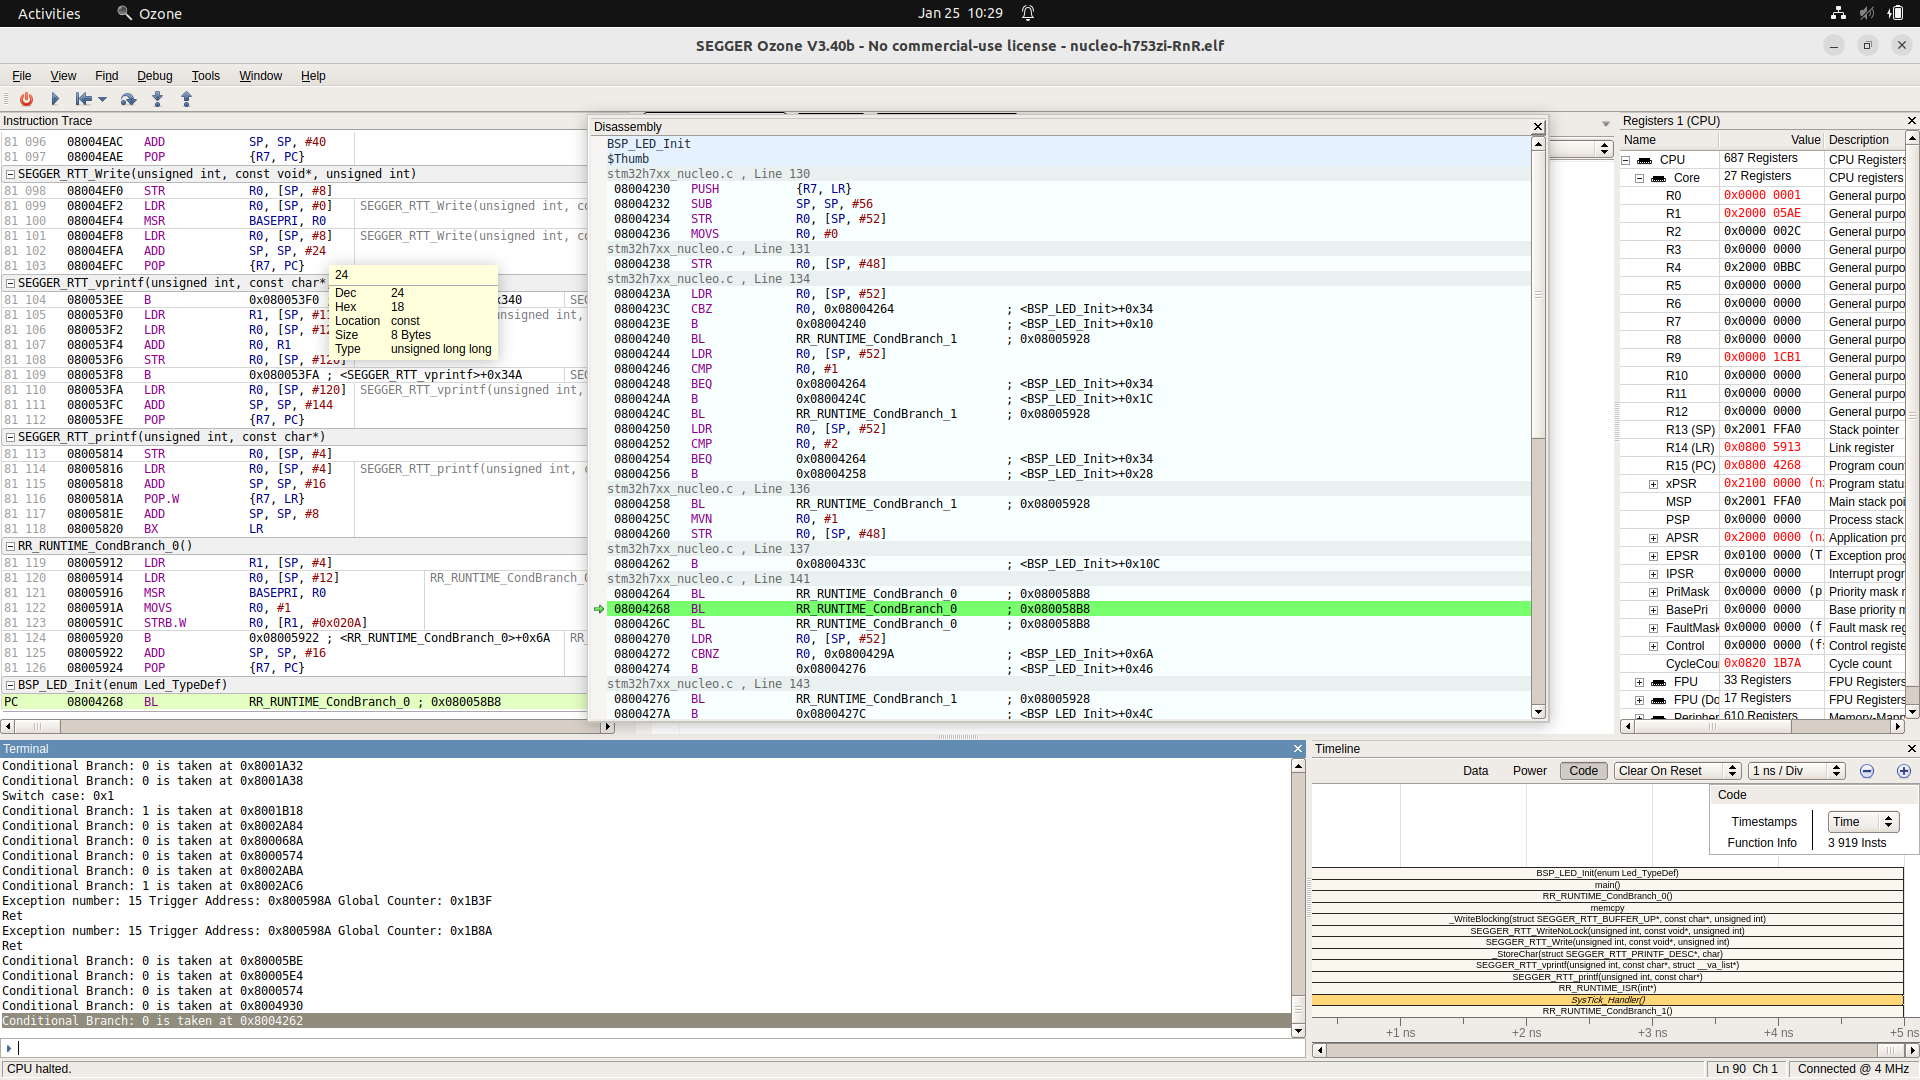
The prototype in Ozone. The disassembly shows inserted RR_RUNTIME_CondBranch calls; the Terminal shows branch, switch, and interrupt messages sent through RTT. This demonstrates event emission, not completed replay.
What the project demonstrated
The write-up shows inserted hooks in the NUCLEO-H753ZI firmware and their RTT messages in Ozone. It also reports a separate hybrid-fuzzing experiment. Parsing the recorded stream and reconstructing that specific execution in the emulator are still work in progress. I have not yet measured runtime overhead, firmware-size changes, trace volume, or event-loss rate.
SystemView provides another point of comparison. It also uses target-side instrumentation to record ISR entry and exit and can timestamp events using the cycle counter on supported Cortex-M devices. My r9 counter serves a different purpose: locating an interrupt within a program’s execution path. The flexibility I care about is choosing which control-flow or state transition to record; measuring the cost of that choice remains future work.